Welcome Guest
LOGIN NOW
← Back


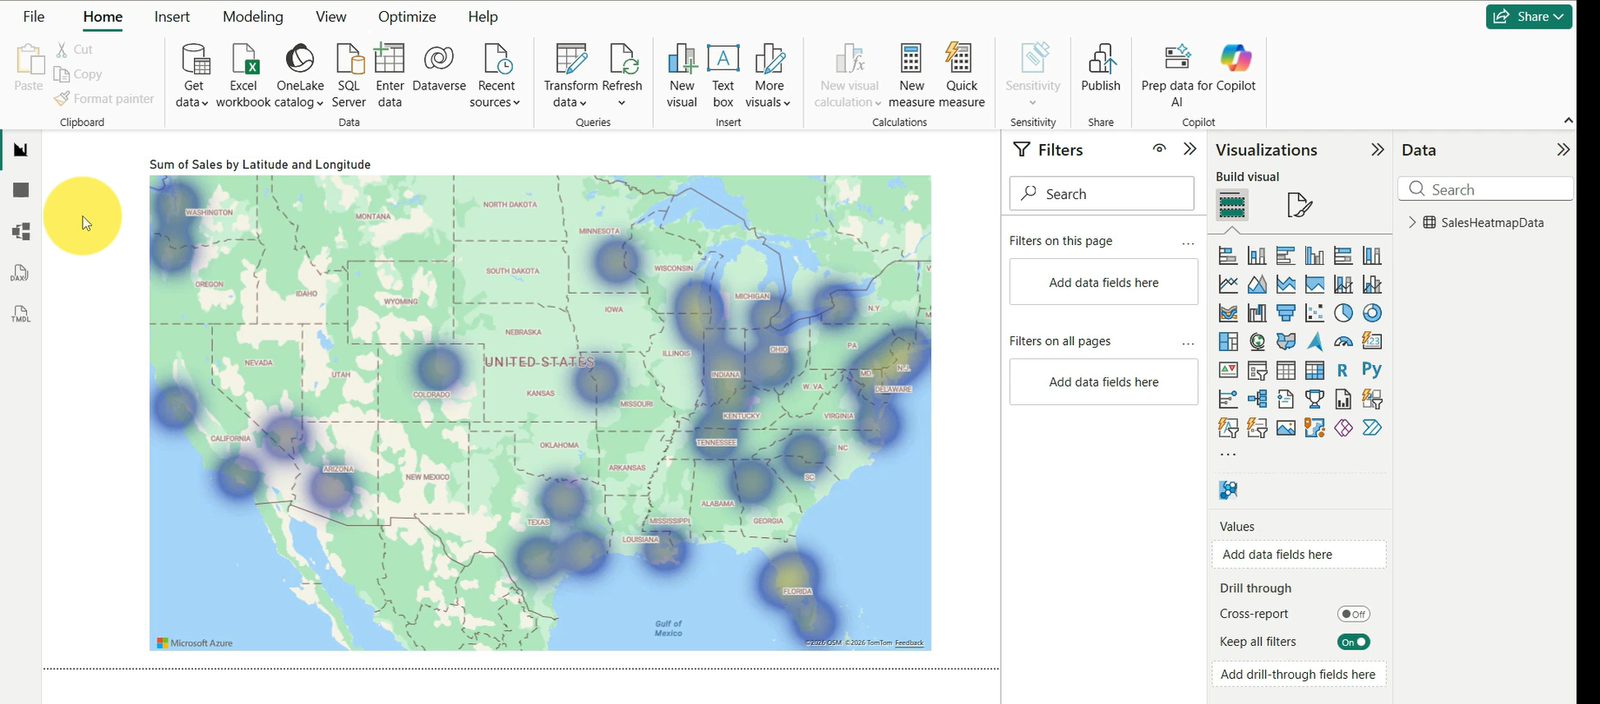
Heatmap Chart in Power BI – Interactive Dashboard Project File & Tutorial
Rs.50 Rs.400
This content is valid for Days after the date of purchase
"This project helps beginners and professionals improve their data visualization and dashboard development skills.
Topics include heatmap design, conditional formatting, KPI analysis, interactive reporting, and advanced Power BI visualization techniques using real-world examples
Features:
- "
Project Features
- Interactive Heatmap Chart Design
- Advanced Power BI Visualization Techniques
- Conditional Formatting Implementation
- Business KPI and Trend Analysis
- Dynamic Dashboard Reporting
- Beginner-Friendly Power BI Learning
- Real-World Dashboard Project Example
- Clean and Professional Dashboard Layout
- Useful for Data Analysts and BI Developers
- Easy-to-Understand Power BI Concepts
- Project File Included for Practice
- Modern Data Reporting Techniques